
Key Points
- MSPs that automate monitoring across device health, applications, networks, drives, and security can resolve issues faster and prevent downtime before it affects end users.
- This checklist covers 28 actionable monitoring conditions, with suggested triggers, thresholds, and remediation steps, that IT teams can adapt to any RMM platform.
- Effective automation means only alerting on conditions you can act on,, automatically remediating common issues by restarting stopped services or performing disk cleanups when needed, and routing tickets by priority to reduce unnecessary alert noise.
- Backup monitoring is a critical and often overlooked layer: Automating alerts for failed jobs across Ninja Data Protection and similar tools is essential for data protection.
- Building a baseline monitoring template, aligning with client priorities, and holding regular alert housekeeping sessions are the habits that separate reactive MSPs from proactive ones.
Endpoint monitoring and alerting is a fundamental part of IT management. If you’re an MSP, good monitoring and alerting practices enable you to proactively identify issues, enabling faster response and remediation while reducing downtime and minimizing the impact on end users.
The challenge is knowing
- what to monitor for,
- what requires an alert,
- which issues can be automatically resolved, and
- which need a personal touch.
That knowledge can take years to develop, and even then, the best IT teams can still struggle with reducing alert fatigue and ticket noise across their networks and devices.
To help condense that ramp-up time and narrow your focus, we’ve put together this list of ideas for conditions to monitor for, along with suggested triggers and actions for automation. These are based on recommendations from our customers and on NinjaOne’s experience in helping IT teams build more effective, actionable monitoring.
How to Use the MSP Monitoring Checklist Below
For each condition, we describe what’s being monitored, how to set up the monitor in NinjaOne, and what actions should be taken if the condition is triggered. Some monitoring suggestions are concrete while others may require a small amount of customization to fit them to your use case.
Note: While we’ve written this checklist with NinjaOne and our customers in mind, these monitoring ideas should be easily adaptable to any RMM or endpoint management solution.
This list is also obviously not exhaustive, and may not apply to every situation or circumstance.
Once you’ve gotten started building out your monitoring plan around these suggestions, you’ll want to develop a more customized and robust monitoring strategy specific to your needs. We’ll close out this post with additional recommendations to help with that effort and make monitoring, alerting, and ticketing more streamlined and effective.
Device Health Monitoring
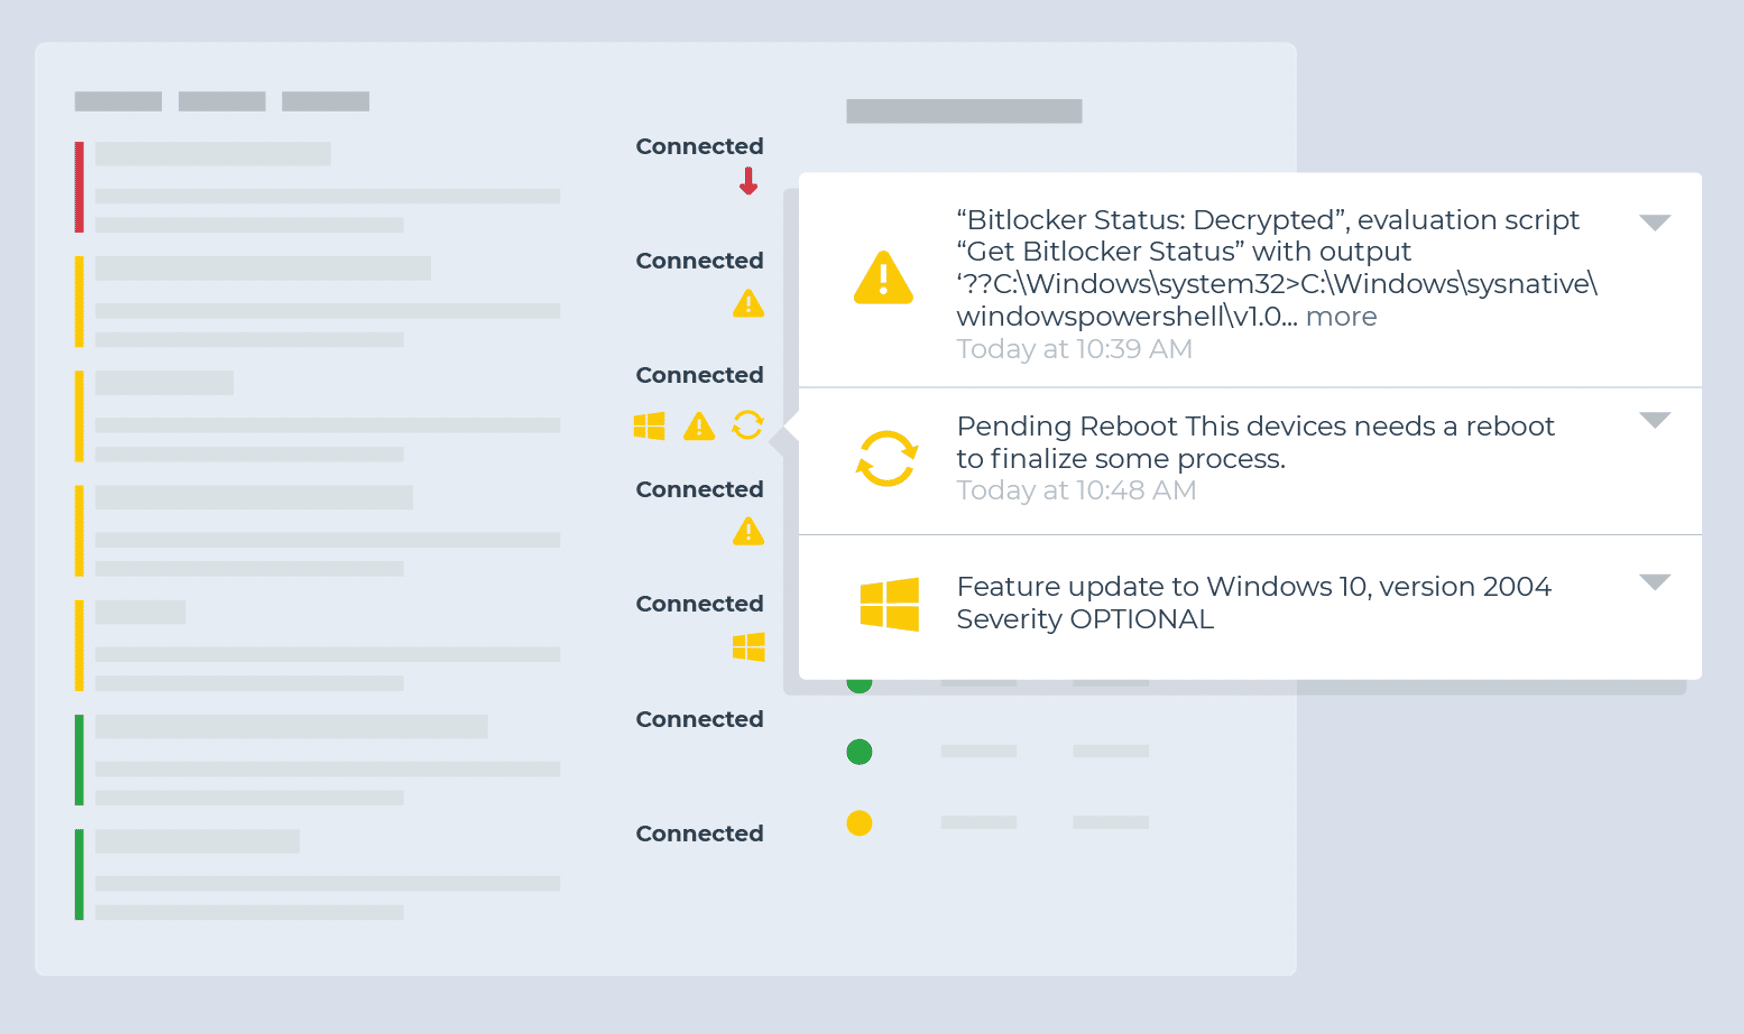
Monitor for continuous critical events
- Condition: Critical Events
- Threshold: 80 critical events over 5 minutes
- Note: The threshold may need fine-tuning or exclusion filters as it could create noise in environments with chatty logs.
- Action: Ticket and investigate
Identify unexpected system shutdowns
- Condition: Windows Event
- Event Source: Microsoft-Windows-Kernel-Power
- Event ID: 41
- Note: This condition is better suited for servers as workstations and laptops can create this error from user intervention.
- Action: Ticket and investigate
Identify devices that may require a reboot
- Condition: System Uptime
- Threshold Recommendation: 30 or 60 days (though may be aggressive for servers with stable workloads)
- Action: Restart the device during an appropriate window. Automated remediation may be appropriate for workstations.
Monitor for offline endpoints
- Condition: Device Down
- Threshold Recommendation:
- 10 minutes or less (servers).
- 24+ hours (workstations)
- Action:
- Ticket and investigate
- Wake-on-LAN (servers only)
Monitor for hardware changes
- Activity: System
- Name: Adapter added/changed, CPU added/removed, Disk drive added/removed, Memory added/removed
- Action: Ticket and Investigate
Drive Monitoring
Monitor for signs of potential disk failure
- Condition: Windows SMART Status Degraded and/or Windows Event
- Event Source: Disk
- Event IDs: 7, 11, 29, 41, 51, 153
- Action: Ticket and Investigate
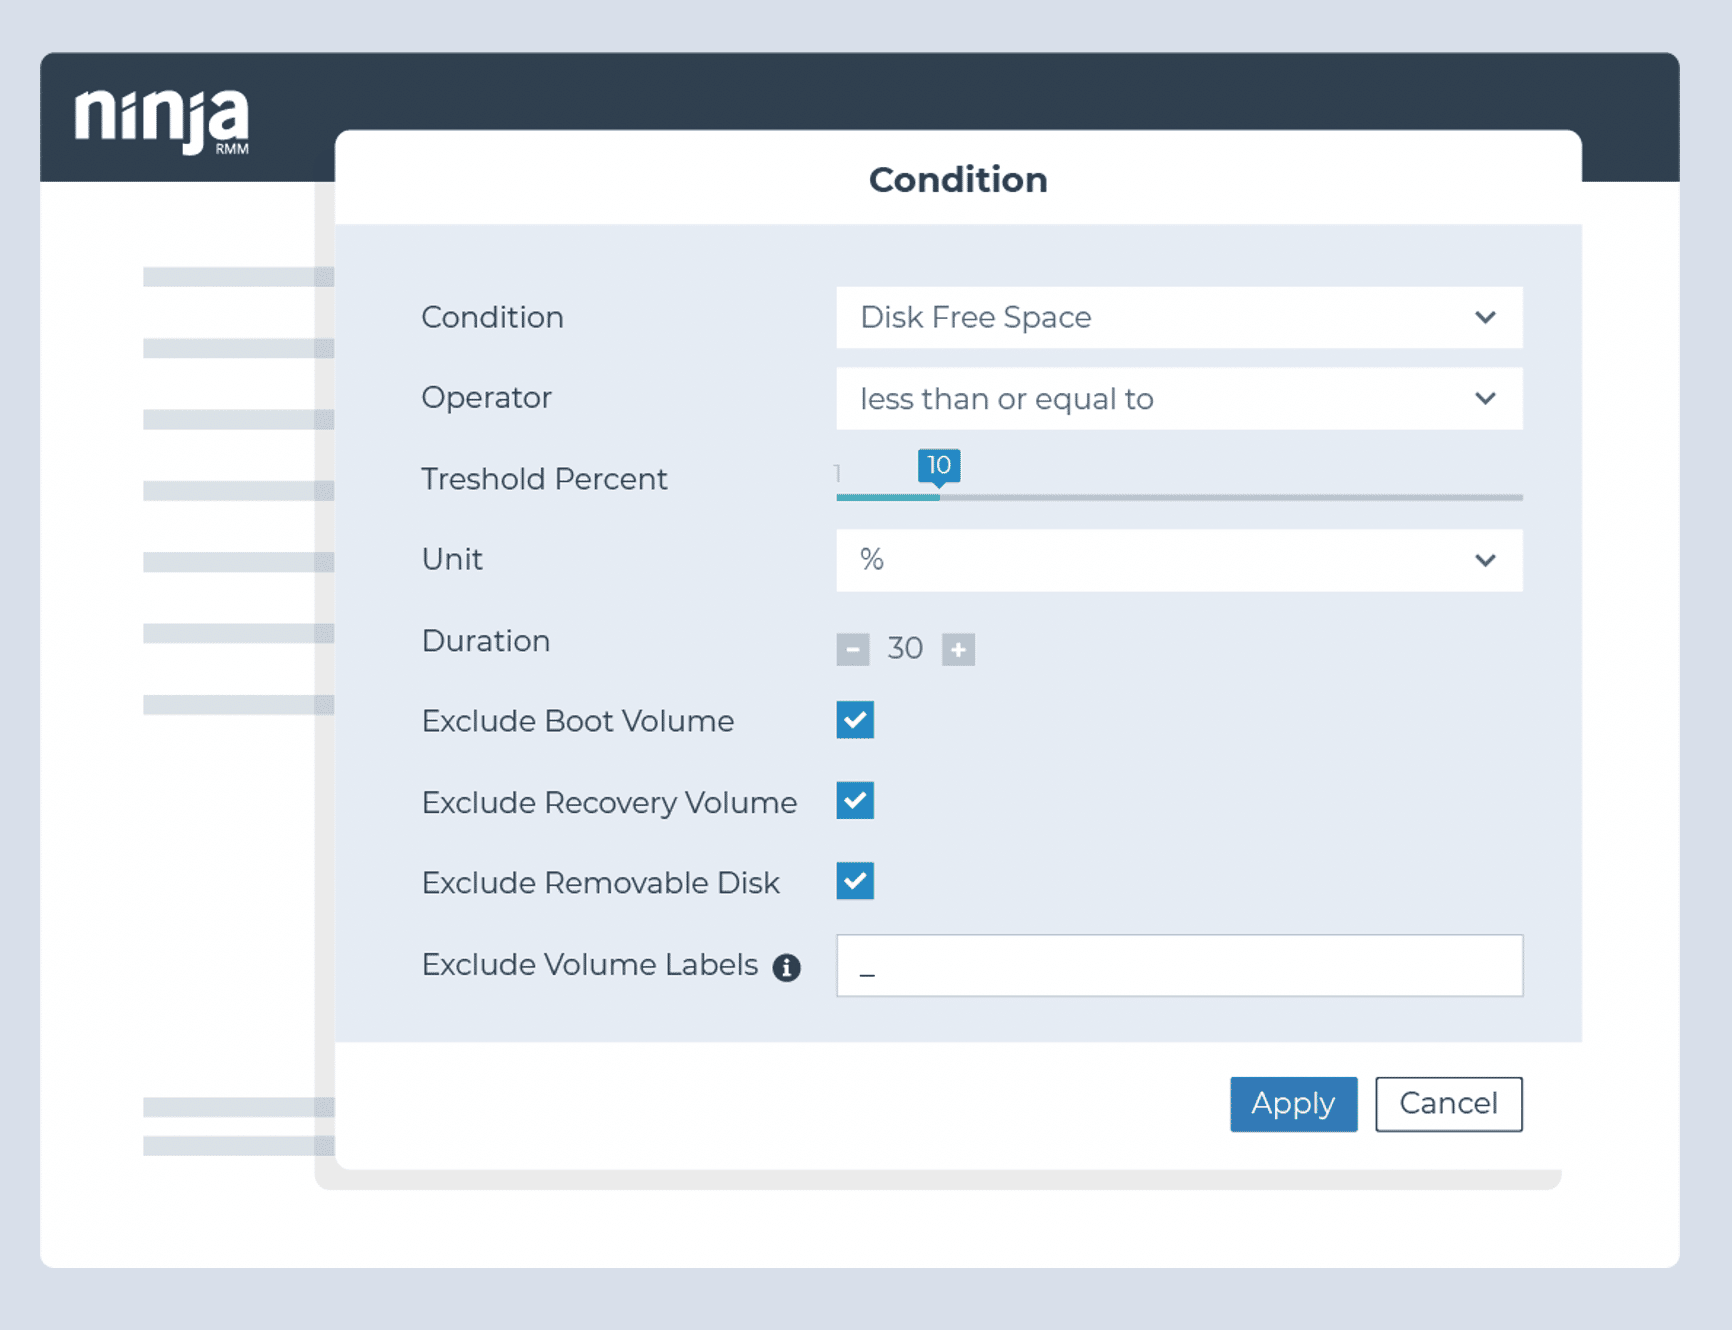
Identify when disk space is approaching capacity
- Condition: Disk Free Space
- Threshold: 20% and again at 10%
- Action: Perform disk cleanup and delete temporary files
Monitor for potential RAID failures
- Condition: RAID Health Status
- Thresholds: Critical and Non-Critical for all attributes
- Action: Ticket and Investigate
Monitor for prolonged high disk usage
- Condition: Disk Usage
- Thresholds: 90% or greater to reduce noise, with 95%+ also being common over 30 or 60-minute periods
- Action: Ticket and Investigate
Monitor for high disk activity rate
- Condition: Disk Active Time
- Thresholds: Greater than 90% for 15 minutes
- Action: Ticket and Investigate
Monitor for high memory usage
- Condition: Memory Utilization
- Thresholds: Greater than 90% for 15 minutes
- Action: Ticket and Investigate
Application Monitoring

Identify if required applications are installed on an endpoint
- Condition: Software
- Usage:
- Client line-of-business applications (e.g., AutoCAD, SAP, Photoshop)
- Client productivity solutions (e.g., Zoom, Microsoft Teams, Dropbox, Slack, Office, Acrobat)
- Client support tools (e.g., TeamViewer, CCleaner, AutoElevate, BleachBit)
- Action: Flag missing applications for review or automatic deployment where appropriate
Monitor whether critical applications and servers are running (particularly for servers)
- Condition: Process or Service
- Threshold: Down for at least 3 minutes
- Example Processes:
- For workstations: TeamViewer, RDP, DLP
- For an Exchange server: MSExchangeServiceHost, MSExchangeIMAP4, MSExchangePOP3
- For an Active Directory server: Netlogon, dnscache, rpcss
- For a SQL server: mssqlserver, sqlbrowser, sqlwriter
- Action: Restart the service or process
Monitor resource usage for applications known to cause performance issues
- Condition: Process Resource
- Threshold: 90%+ for at least 5 minutes
- Example Processes: Outlook, Chrome, and TeamViewer
- Action:
- Ticket and investigate
- Disable at startup
Monitor for application hang
- Condition: Windows Event
- Source: Application Hang
- Event ID: 1002
- Action: Ticket and Investigate
Network Monitoring

Monitor for unexpected network utilization
- Condition: Network Utilization
- Direction: Out
- Threshold: Determined by the type of endpoint and network capacity
- Each server should have its own threshold based on its use case
- Workstation network monitor thresholds should be high enough to trigger only when a client’s network is at risk
- Action: Ticket and investigate
Ensure network devices are up
- Condition: Device Down
- Duration: 3 minutes
Monitor the availability of specific network ports
- Condition: Cloud Monitor
- Ports: 80 (HTTP), 443 (HTTPS), 25 (SMTP), 21 (FTP)
Monitor client website availability
- Monitor: Ping
- Target: Client Website
- Condition: Failure (5 times)
- Action: Ticket and investigate
Basic Security Monitoring

Identify if Windows Firewall has been turned off
- Condition: Windows Event
- Event Source: System
- Event ID: 5025
- Action: Turn on Windows Firewall
Identify if antivirus and security tools are installed and/or running on an endpoint
- Condition: Software
- Presence: Doesn’t Exist
- Software Examples: Huntress, Cylance, Threatlocker, Sophos
- Action: Automate the installation of the missing security software
- Condition: Process or Service
- State: Down
- Example Processes: threatlockerservice.exe, EPUpdateService.exe
- Action: Restart the process
Monitor for unintegrated AV/EDR threats detected
- Condition: Windows Event
- Example: Sophos
- Event Source: Sophos antivirus
- Event IDs: 6, 16, 32, 42
Monitor failed logon attempts and account lockouts
- Condition: Windows Event
- Event Source: Microsoft-Windows-Security-Auditing
- Event IDs: 4625, 4740 (local accounts; 644 applies to legacy Windows Server 2003 systems only)
- Action: Ticket and Investigate
Monitor for user account creation and privileged group membership changes
- Condition: Windows Event
- Event Source: Microsoft-Windows-Security-Auditing
- Event IDs: 4720, 4732, 4729
- Action: Ticket and Investigate
Identify if the drives on an endpoint are encrypted/unencrypted
- Condition: Script Result
- Script (Custom): Check Encryption Status
- Action: Ticket and Investigate
Monitor backup failures (Ninja Data Protection)
- Activity: Ninja Data Protection
- Name: Backup job failed
Monitor backup failures (other backup vendors)
- Condition: Windows Event
- Example Source/IDs (Veeam):
- Event Source: Veeam Agent
- Event ID: 190
- Text Contains: Failed
- Example Source/IDs (Acronis):
- Event Source: Online Backup System
- Event ID: 1
- Text Contains: Failed
4 Keys to Leveling Up Your MSP Monitoring
- Create a baseline device health monitoring template.
- Talk to customers about their priorities.
- Which servers and workstations are important?
- What are their critical line-of-business or productivity applications?
- Where are their IT pain points?
- Monitor your PSA/ticketing system for recurring issues. Also, adjust alerting to avoid ticket noise.
- Monitor clients’ event logs for recurring issues.
Ticketing and Alerting Best Practices
- Only generate alerts for actionable conditions. If a monitored condition does not require a defined response, consider collecting it for visibility rather than generating an alert.
- Categorize your alerts to go to different service boards in your PSA based on the type or priority.
- Host regular alert housekeeping meetings to answer the following questions:
- Which alerts are causing the most noise? Can they be removed or narrowed in scope?
- What’s not being monitored or creating notifications that should be?
- Which common alerts can be automatically remediated?
- Are there any upcoming projects that may generate alerts?
- Clean up your tickets and alerts when they’re resolved.
- In NinjaOne, many conditions have a “Reset when no longer true” or “Reset when not true for x period” to help you resolve and clean up notifications that may resolve themselves.
More MSP Monitoring Ideas
See Kelvin Tegelaar’s excellent series on remote monitoring using PowerShell. He covers how to monitor everything from network traffic to Active Directory health, Office 365 failed logins, Shodan results, and more. Best of all, he shares PowerShell scripts that are designed to be RMM agnostic. You can also read our blog post on PowerShell vs CMD Prompt differences and when to use each.
In addition, if you’re looking for software to help you automate how you monitor all your IT assets, NinjaOne’s IT asset management solution offers a complete and real-time view of your resources as well as lets you manage software on your endpoints at scale. Watch a demo of NinjaOne in action or sign up for a free trial of the software.